
The Short Answer: SaaS KPIs (Key Performance Indicators) are specific metrics that show how efficiently your business is growing – covering revenue, retention, and customer acquisition. These figures help guide your hiring, pricing, and go-to-market decisions.
The “grow at any cost” era is over. The most successful companies have shifted their focus from vanity metrics to numbers that drive profitable growth and long-term success.
Many SaaS founders have the same question: “Which metrics should I actually be tracking?” There are hundreds of different numbers you could monitor, but most of them won’t change how you run your business.
Let’s break down the SaaS metrics that matter most to help you focus on what actually moves the needle.
Table of Contents
SaaS KPIs by Business Stage
|
Business Stage
|
Revenue Range
|
Top Priority Metrics
|
Key Targets
|
|---|---|---|---|
|
Early Stage (Pre-/Post-PMF)
|
$0-$1M ARR
|
MRR, Churn Rate, CAC, Activation Rate, Burn Rate / Runway
|
10–20% MoM MRR growth <$500 CAC (SMB) or <$2,000 (enterprise) <10% monthly churn 40–60% activation rate 12–18 months runway
|
|
Growth Stage
|
$1M-$10M ARR
|
ARR, NRR, Lead Velocity Rate (LVR), Gross Margin, Customer Lifetime Value (LTV) to CAC (Customer Acquisition Cost) Ratio
|
100%+ YoY ARR growth 110–120%+ NRR 30%+ YoY lead velocity growth 70–80%+ gross margins 3:1+ LTV:CAC ratio
|
|
Scale Stage
|
$10M+ ARR
|
Sales Efficiency (Magic Number), Customer Health Score / Predictive Churn, Rule of 40 (Growth % + Profit Margin %), CAC Payback, Net Promoter Score (NPS)
|
≥1.0 Sales Efficiency (Magic Number), ideal 1.5+ >90% Gross Revenue Retention (GRR) Rule of 40 ≥40% (growth + profit margin) 60)
|
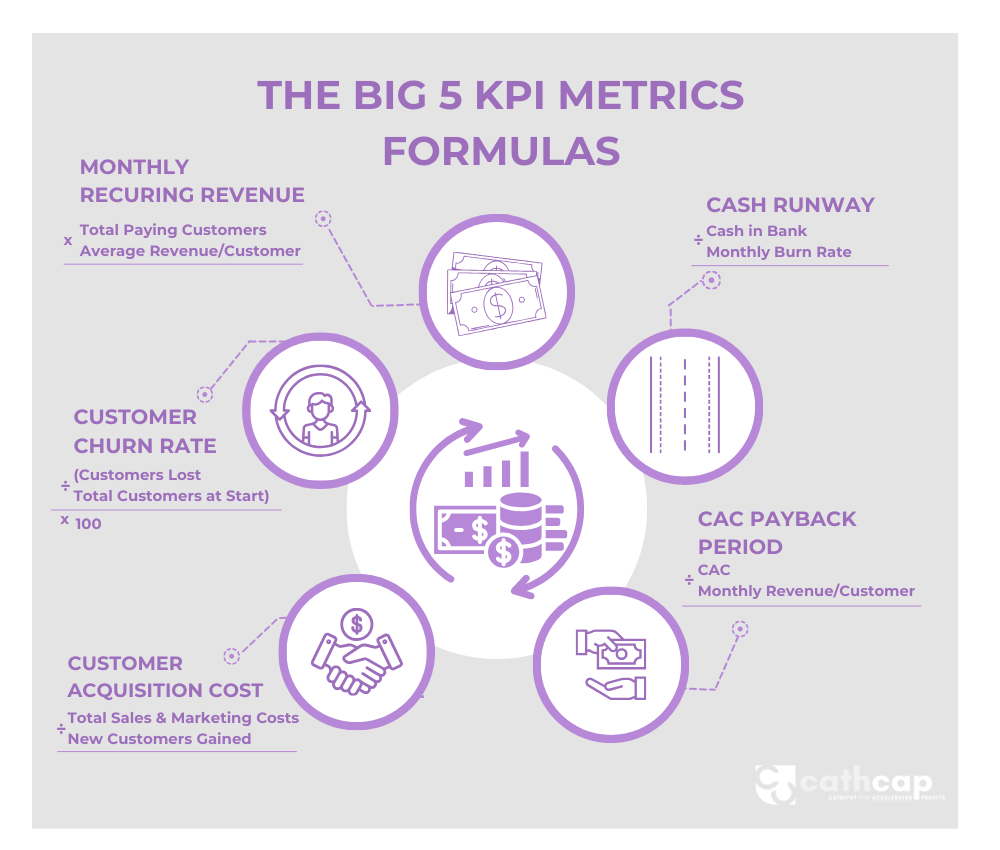
The Big 5 Metrics for Early Stage SaaS
Don’t overwhelm yourself with dozens of metrics. Track these 5 numbers and you’ll better understand what matters for product-market fit and early growth:
1. Monthly Recurring Revenue (MRR) – Your most important number
-
MRR = Total Number of Active Accounts × Average Revenue Per Account (ARPA)
-
Track: New MRR, Expansion MRR, Lost MRR
2. Customer Churn Rate – What percentage you lose monthly
-
Calculation: (Customers Lost ÷ Total Customers at Start) × 100
-
Reality: 5-10% is normal while finding product-market fit
3. Customer Acquisition Cost (CAC) – Cost to get each new customer
-
Calculation: Total Sales & Marketing Costs ÷ New Customers
-
Target: B2B SaaS under $500, B2C SaaS under $100
4. CAC Payback Period – Time to earn back acquisition cost
-
Calculation: CAC ÷ Monthly Revenue per Customer
-
Target: Under 12 months (best hit 5-7 months)
5. Cash Runway – How long your money lasts
-
Calculation: Cash in Bank ÷ Monthly Burn Rate
-
Target: 18-24 months
Growth & Scale Stage: Key Additions
Annual Recurring Revenue (ARR): Gives a big picture view of revenue
-
Formula: MRR × 12
-
Benchmarks: Early stage: 100%+ YoY growth, Growth stage: 50-100% YoY, Scale stage: 20-50% YoY
Net Revenue Retention (NRR): Shows if existing customers spend more over time
-
Formula: (Starting Revenue + Expansions - Cancellations) ÷ Starting Revenue × 100
-
Benchmarks: Under 100% = net loss, 100-110% = average, 120%+ = elite (common for PLG companies)
Lead Velocity Rate (LVR): Predicts future sales problems 2-3 months early
-
Formula: (This Month's Leads - Last Month's Leads) ÷ Last Month's Leads × 100
-
Benchmarks: 15-20% monthly growth = healthy, declining LVR = future revenue warning
The Must-Track Metrics: Core Numbers Every SaaS Company Needs
Customer Lifetime Value (CLV)
This shows the total revenue you’ll make from each customer.
Correct Formula: (Monthly Revenue per Customer × Gross Margin %) ÷ Monthly Churn Rate
Example: If customers pay $100/month, you have 80% gross margins, and 4% monthly churn: CLV = ($100 × 0.80) ÷ 0.04 = $2,000
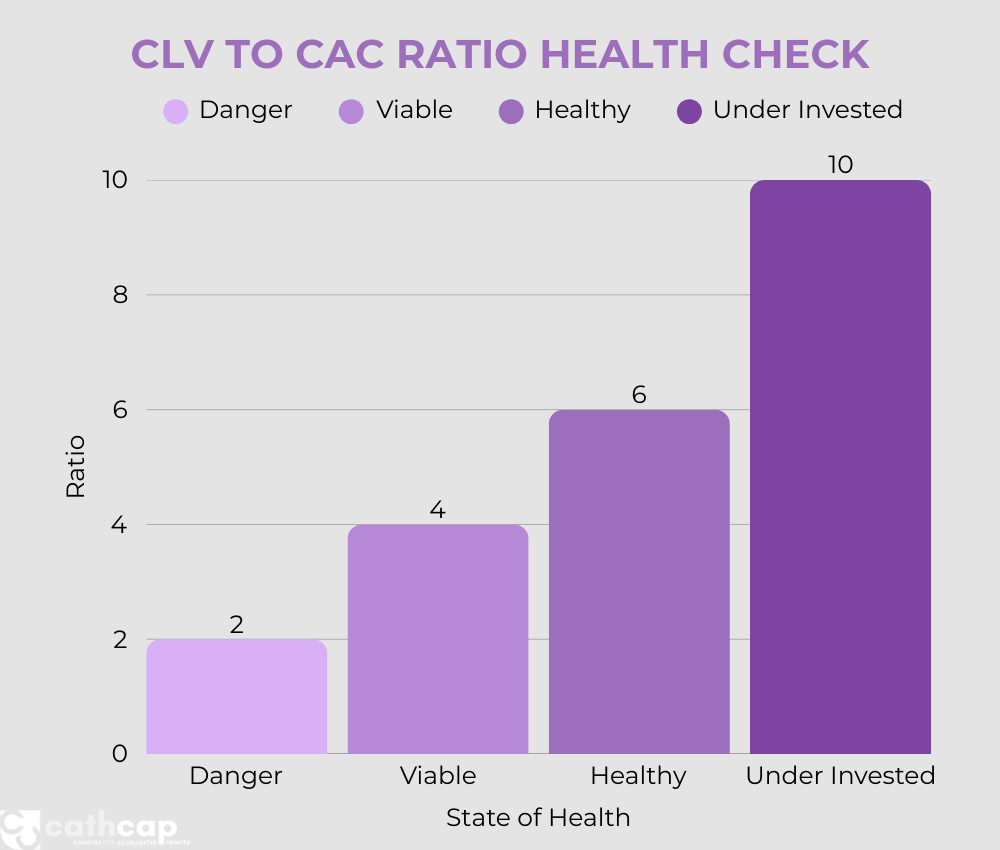
CLV to CAC Ratio
This ratio determines if your business model works.
Formula: CLV ÷ CAC
CLV to CAC Ratio Health Check:
-
Under 3:1 (3.0) - Business model broken, fix immediately
-
3:1 to 5:1 (3.0 - 5.0) - Minimum viable, room for improvement
-
5:1 to 10:1 (5.0 - 10.0) - Healthy and sustainable
-
Over 10:1 (10.0+) - Consider investing more in growth
Average Revenue Per User (ARPU)
Track ARPU by customer segment to understand which customers are most valuable.
How to Calculate: Total Monthly Revenue ÷ Total Customers
Pro Tip: ARPU should increase over time as you get better at pricing and targeting.
Why 2025 is Different for SaaS Metrics
The SaaS landscape has changed. Growth without profits isn’t sustainable anymore.
Our best-performing clients now focus on:
-
Keeping customers longer (cheaper than finding new ones)
-
Making money on every customer (not losing money to grow)
-
Tracking leading indicators (spotting problems early)
-
Balancing growth with efficiency (the new Rule of 40)
What We've Learned from Our SaaS Clients
Working with SaaS companies has taught us a lot about what actually works. Here are the insights we share with every client:
Start Simple
Most founders try to track everything and end up paralyzed by data. We’ve seen it happen countless times.
Start with 3-5 core numbers that align with your current stage, then add more as you grow.
Start Simple
Most founders try to track everything and end up paralyzed by data. We’ve seen it happen countless times.
Start with 3-5 core numbers that align with your current stage, then add more as you grow.
Your Context Matters More Than Benchmarks
Industry averages are helpful for reference, but your specific market and business model create unique dynamics.
We help our clients establish their own baseline and focus on improving over time, not just hitting generic benchmarks.
Look Forward, Not Just Backward
The most successful companies balance historical metrics (like MRR and churn) with forward-looking indicators (like Lead Velocity Rate and Customer Health Scores).
These help you spot problems months before they impact your bottom line.
Every Metric Should Drive Action
Here’s the test we use with clients: if a metric doesn’t influence how you spend time or money, stop tracking it.
Your KPIs should connect directly to business decisions, not just look impressive on a dashboard.
Common Mistakes to Avoid
-
Tracking vanity metrics - Total users and social media followers don't predict revenue
-
Wrong calculations - Many founders calculate CAC and CLV incorrectly, leading to bad decisions
-
Single metric focus - Optimizing just churn or just growth creates other problems
-
Ignoring cohorts - Average numbers hide important trends. Look at performance by customer group
-
No action connection - Every metric should drive a specific business decision
Every Metric Should Drive Action
As fractional CFO, we help companies move beyond just tracking numbers. We help you understand what those numbers really mean and how to use them to grow smarter, not just faster.
Here’s how we support our clients:
-
Focus on what matters for your specific business stage and goals
-
Interpret data correctly so you can make confident decisions
-
Prepare for investors with compelling stories backed by solid metrics
-
Scale financial operations without breaking your budget
The companies that thrive understand that good metrics lead to good decisions. But you need someone who knows which numbers matter and how to act on what you learn.


Recent Comments